Tip
An interactive online version of this notebook is available, which can be
accessed via
![]()
Alternatively, you may download this notebook and run it offline.
Attention
You are viewing this notebook on the latest version of the documentation, where these notebooks may not be compatible with the stable release of PyBaMM since they can contain features that are not yet released. We recommend viewing these notebooks from the stable version of the documentation. To install the latest version of PyBaMM that is compatible with the latest notebooks, build PyBaMM from source.
Half-cell models in PyBaMM#
PyBaMM supports both negative and positive half-cells. In both cases, the working electrode is considered to be the positive electrode and lithium metal the negative electrode. The difference is solely down to the material the positive electrode is made of. This notebook demonstrates how to simulate half-cells made of a range of materials.
[1]:
%pip install pybamm -q  # install PyBaMM if it is not installed
import pybamm
import matplotlib.pyplot as plt
Note: you may need to restart the kernel to use updated packages.
To simulate a half-cell, pass {"working electrode": "positive"} to the options dictionary. This deletes the negative electrode and replaces it with lithium metal, which has a fixed open-circuit voltage of zero. First, we load the NMC-based positive half-cell studied by Xu et al. [12]
[2]:
model = pybamm.lithium_ion.DFN({"working electrode": "positive"})
param_nmc = pybamm.ParameterValues("Xu2019")
Start by simulating a pseudo-OCV cycle:
[3]:
exp_slow = pybamm.Experiment(
    ["Discharge at C/25 until 3.5 V", "Charge at C/25 until 4.2 V"]
)
sim1 = pybamm.Simulation(model, parameter_values=param_nmc, experiment=exp_slow)
sol1 = sim1.solve()
t = sol1["Time [s]"].entries
V = sol1["Voltage [V]"].entries
plt.figure()
plt.plot(t, V)
plt.xlabel("Time [s]")
plt.ylabel("Voltage [V]")
plt.show()
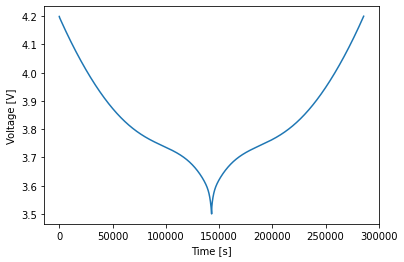
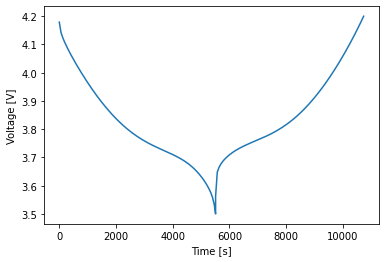
The charge and discharge curves are the same, as expected. This is not the case for faster cycles:
[4]:
exp_fast = pybamm.Experiment(
    ["Discharge at 1C until 3.5 V", "Charge at 1C until 4.2 V"]
)
sim2 = pybamm.Simulation(model, parameter_values=param_nmc, experiment=exp_fast)
sol2 = sim2.solve()
t = sol2["Time [s]"].entries
V = sol2["Voltage [V]"].entries
plt.figure()
plt.plot(t, V)
plt.xlabel("Time [s]")
plt.ylabel("Voltage [V]")
plt.show()
At t = 285.669 and h = 7.17426e-14, the corrector convergence failed repeatedly or with |h| = hmin.
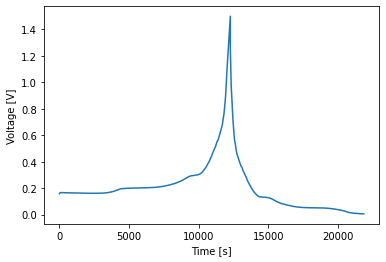
Next, load a negative half-cell with a graphite-silicon composite as the positive electrode. This is the negative half of the full cell studied by O’Kane et al. [9] and therefore supports all the degradation mechanisms included in that paper. Just like in the coupled degradation notebook, use the options dictionary to switch the mechanisms on and off. Unlike for a full cell, the SEI option
applies to the lithium metal electrode as well as the positive electrode. To set different options for each, use a 2-tuple. The SEI on cracks and lithium plating options do not work on the lithium metal electrode.
[5]:
model_with_degradation = pybamm.lithium_ion.DFN(
{
"working electrode": "positive",
"SEI": "reaction limited", # SEI on both electrodes
"SEI porosity change": "true",
"particle mechanics": "swelling and cracking",
"SEI on cracks": "true",
"lithium plating": "partially reversible",
"lithium plating porosity change": "true", # alias for "SEI porosity change"
}
)
param_GrSi = pybamm.ParameterValues("OKane2022_graphite_SiOx_halfcell")
param_GrSi.update({"SEI reaction exchange current density [A.m-2]": 1.5e-07})
var_pts = {"x_n": 1, "x_s": 5, "x_p": 7, "r_n": 1, "r_p": 30}
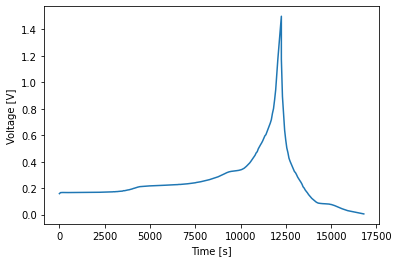
exp_degradation = pybamm.Experiment(
["Charge at 0.3C until 1.5 V", "Discharge at 0.3C until 0.005 V"]
)
sim3 = pybamm.Simulation(
model_with_degradation,
parameter_values=param_GrSi,
experiment=exp_degradation,
var_pts=var_pts,
)
sol3 = sim3.solve()
t = sol3["Time [s]"].entries
V = sol3["Voltage [V]"].entries
plt.figure()
plt.plot(t, V)
plt.xlabel("Time [s]")
plt.ylabel("Voltage [V]")
plt.show()
In order to get SEI growth to work on both electrodes, we had to add domains to the names of the degradation variables. Bear this in mind when writing your code.
[6]:
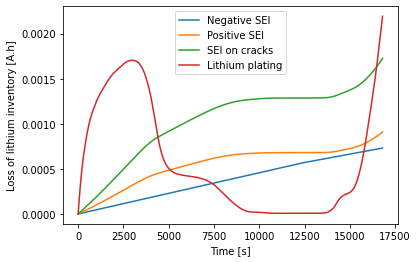
Q_SEI_n = sol3["Loss of capacity to negative SEI [A.h]"].entries
Q_SEI_p = sol3["Loss of capacity to positive SEI [A.h]"].entries
Q_SEI_cr = sol3["Loss of capacity to positive SEI on cracks [A.h]"].entries
Q_pl = sol3["Loss of capacity to positive lithium plating [A.h]"].entries
plt.figure()
plt.plot(t, Q_SEI_n, label="Negative SEI")
plt.plot(t, Q_SEI_p, label="Positive SEI")
plt.plot(t, Q_SEI_cr, label="SEI on cracks")
plt.plot(t, Q_pl, label="Lithium plating")
plt.xlabel("Time [s]")
plt.ylabel("Loss of lithium inventory [A.h]")
plt.legend()
plt.show()
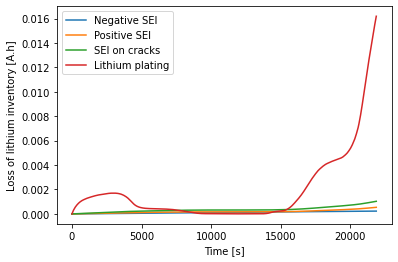
The SEI growth is slow compared to the reversible component of the lithium plating. What happens if the SEI growth rate is increased?
[7]:
param_GrSi.update({"SEI reaction exchange current density [A.m-2]": 6e-07})
sim4 = pybamm.Simulation(
    model_with_degradation,
    parameter_values=param_GrSi,
    experiment=exp_degradation,
    var_pts=var_pts,
)
sol4 = sim4.solve()
t = sol4["Time [s]"].entries
V = sol4["Voltage [V]"].entries
plt.figure()
plt.plot(t, V)
plt.xlabel("Time [s]")
plt.ylabel("Voltage [V]")
plt.show()
[8]:
Q_SEI_n = sol4["Loss of capacity to negative SEI [A.h]"].entries
Q_SEI_p = sol4["Loss of capacity to positive SEI [A.h]"].entries
Q_SEI_cr = sol4["Loss of capacity to positive SEI on cracks [A.h]"].entries
Q_pl = sol4["Loss of capacity to positive lithium plating [A.h]"].entries
plt.figure()
plt.plot(t, Q_SEI_n, label="Negative SEI")
plt.plot(t, Q_SEI_p, label="Positive SEI")
plt.plot(t, Q_SEI_cr, label="SEI on cracks")
plt.plot(t, Q_pl, label="Lithium plating")
plt.xlabel("Time [s]")
plt.ylabel("Loss of lithium inventory [A.h]")
plt.legend()
plt.show()
The additional SEI increases the cell resistance, preventing the graphite-silicon composite from being fully lithiated, so there is less plating than before.
[9]:
pybamm.print_citations()
[1] Weilong Ai, Ludwig Kraft, Johannes Sturm, Andreas Jossen, and Billy Wu. Electrochemical thermal-mechanical modelling of stress inhomogeneity in lithium-ion pouch cells. Journal of The Electrochemical Society, 167(1):013512, 2019. doi:10.1149/2.0122001JES.
[2] Joel A. E. Andersson, Joris Gillis, Greg Horn, James B. Rawlings, and Moritz Diehl. CasADi – A software framework for nonlinear optimization and optimal control. Mathematical Programming Computation, 11(1):1–36, 2019. doi:10.1007/s12532-018-0139-4.
[3] Chang-Hui Chen, Ferran Brosa Planella, Kieran O'Regan, Dominika Gastol, W. Dhammika Widanage, and Emma Kendrick. Development of Experimental Techniques for Parameterization of Multi-scale Lithium-ion Battery Models. Journal of The Electrochemical Society, 167(8):080534, 2020. doi:10.1149/1945-7111/ab9050.
[4] Rutooj Deshpande, Mark Verbrugge, Yang-Tse Cheng, John Wang, and Ping Liu. Battery cycle life prediction with coupled chemical degradation and fatigue mechanics. Journal of the Electrochemical Society, 159(10):A1730, 2012. doi:10.1149/2.049210jes.
[5] Marc Doyle, Thomas F. Fuller, and John Newman. Modeling of galvanostatic charge and discharge of the lithium/polymer/insertion cell. Journal of the Electrochemical society, 140(6):1526–1533, 1993. doi:10.1149/1.2221597.
[6] Charles R. Harris, K. Jarrod Millman, Stéfan J. van der Walt, Ralf Gommers, Pauli Virtanen, David Cournapeau, Eric Wieser, Julian Taylor, Sebastian Berg, Nathaniel J. Smith, and others. Array programming with NumPy. Nature, 585(7825):357–362, 2020. doi:10.1038/s41586-020-2649-2.
[7] Scott G. Marquis. Long-term degradation of lithium-ion batteries. PhD thesis, University of Oxford, 2020.
[8] Simon E. J. O'Kane, Ian D. Campbell, Mohamed W. J. Marzook, Gregory J. Offer, and Monica Marinescu. Physical origin of the differential voltage minimum associated with lithium plating in li-ion batteries. Journal of The Electrochemical Society, 167(9):090540, may 2020. URL: https://doi.org/10.1149/1945-7111/ab90ac, doi:10.1149/1945-7111/ab90ac.
[9] Simon E. J. O'Kane, Weilong Ai, Ganesh Madabattula, Diego Alonso-Alvarez, Robert Timms, Valentin Sulzer, Jacqueline Sophie Edge, Billy Wu, Gregory J. Offer, and Monica Marinescu. Lithium-ion battery degradation: how to model it. Phys. Chem. Chem. Phys., 24:7909-7922, 2022. URL: http://dx.doi.org/10.1039/D2CP00417H, doi:10.1039/D2CP00417H.
[10] Valentin Sulzer, Scott G. Marquis, Robert Timms, Martin Robinson, and S. Jon Chapman. Python Battery Mathematical Modelling (PyBaMM). Journal of Open Research Software, 9(1):14, 2021. doi:10.5334/jors.309.
[11] Lars Ole Valøen and Jan N Reimers. Transport properties of lipf6-based li-ion battery electrolytes. Journal of The Electrochemical Society, 152(5):A882, 2005.
[12] Shanshan Xu, Kuan-Hung Chen, Neil P Dasgupta, Jason B Siegel, and Anna G Stefanopoulou. Evolution of dead lithium growth in lithium metal batteries: experimentally validated model of the apparent capacity loss. Journal of The Electrochemical Society, 166(14):A3456, 2019.
[ ]: